Cobalt Juniors in Play Again Soon?
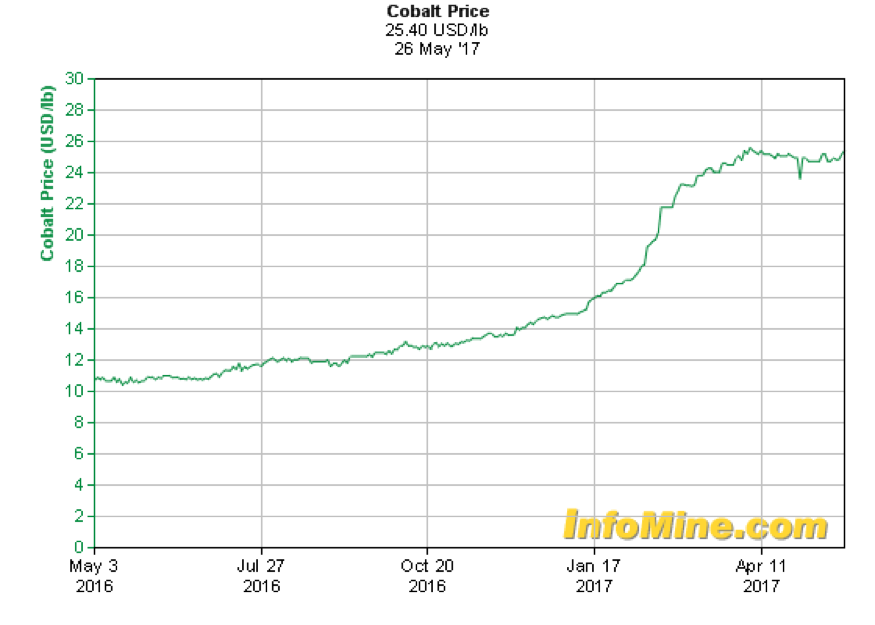
I think so. In fact, I’m quite confident that cobalt itself and in particular the companies looking for it or producing it are going higher. Cobalt prices have soared 150% in the past year going from just over $10 to over $25 per pound, yet it seems that many investors are unaware. Cobalt, like lithium, is a critical component in lithium ion batteries. The problem is that demand is greatly outstripping supply and over half of all cobalt comes from the DRC (Congo), plagued by serious child labor abuses and political instability.
I am not going to dive deeply into the macro argument for cobalt nor the micro validity of the projects owned by the companies I’m long. Instead, this is essentially a technical alert and shares of both Cruz Cobalt (CUZ.V/BKTPF) and Fortune Minerals (FT.TO/FTMDF) can be bought about 40% cheaper than their January 2017 highs. If they recover to test those highs, traders/investors could generate 50-60% returns. I’m targeting 40-50% returns in each stock by the end of the year, which isn’t bad!
The charts are set up as such that stop loss limits of 15% can be implemented to protect downside risk. The Cruz Cobalt weekly chart looks quite ripe for a run to 30 cents in the coming weeks/months…
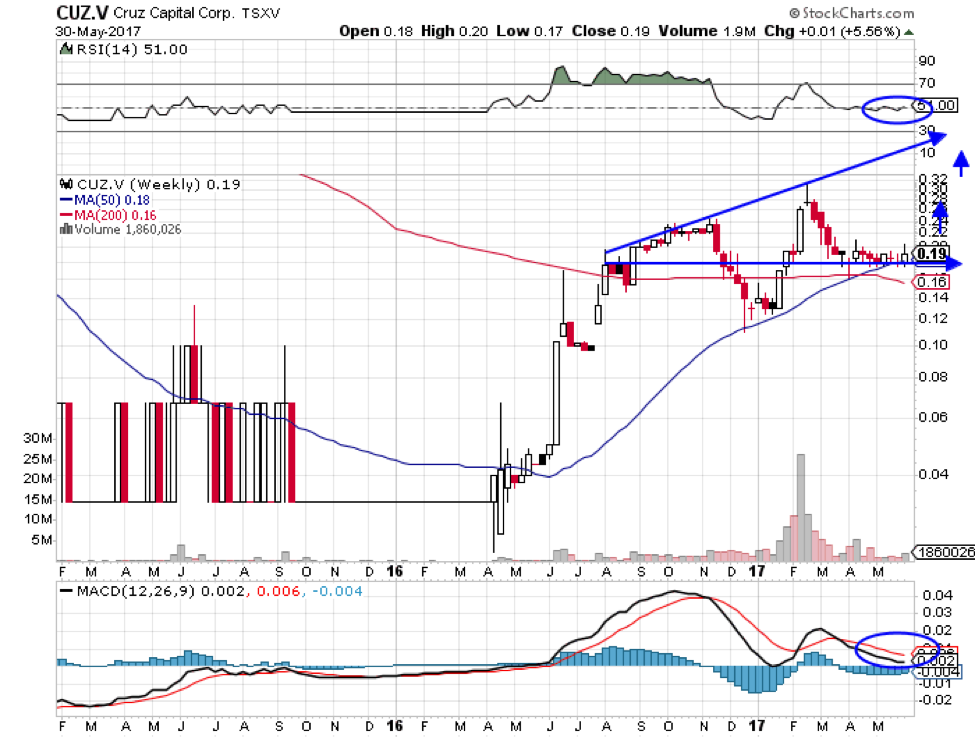
Forgive the markings but I wanted to point out the RSI back at mid-level (51) working completely off the overbought conditions in 2016 and early 2017. The 50 week moving average at 18 cents has held up keeping higher highs/lows intact, which is bullish. If investors give the 50 week MA 15% leeway you have the 200 week MA as the back stop. If that is broken on the downside then something is wrong and I would close out the trade. But, unless that happens, this stock is going higher and we recently saw a “golden cross” last month where the 50 WMA bested the 200 WMA, also quite bullish. I’m forecasting a 50% move in CUZ to .285 from yesterday’s closing price of 19 cents. A retest of the previous high at 32 cents would be a 60% gain from here with 15% downside.
If cobalt continues its ascent, new highs are quite feasible as well. The top trend line blue arrow points to where resistance would be I that case, around 40 cents. High .30’s if it happens sooner (June-July) and low .40’s if it happens later (August-November).
We see the same setup in Fortune Minerals:
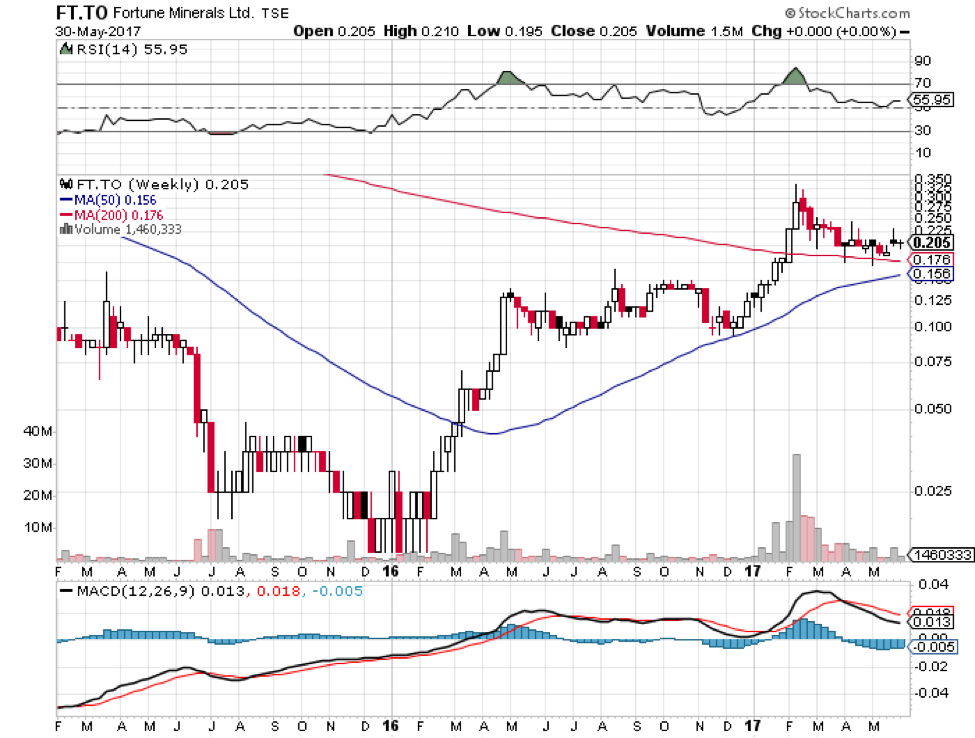
This is also a clearly bullish chart although the golden cross has yet to be confirmed and a stop limit at the 50 WMA in this case would be more like 20-25% versus 15% in CUZ. I think they are both going higher but personally own 3 times more CUZ than FT, although Fortune is lower risk. FT is later stage in their asset development versus Cruz which is a prospect generator model. Pick your fancy as they will both trade with the sector yet I find their charts to be similarly compelling. A similar 40-50% move in Fortune is my target as well (30 cents CDN).
In the case of Cobalt the “trend is your friend” and until it is broken on the downside the smart money is staying long. I feel that I am playing this relatively “safe” by just taking the meat out of the next movement which looks pretty clear to me. That approach versus hoping that cobalt will rise indefinitely and CUZ/FT trade to $2 each is preferred for me at this stage. Certainly with a 50% trading profit, if it materializes, I likely will let me “free shares” in both ride and see where this market goes in time.
The fundamentals of the cobalt market (along with lithium) are worth exploring further. Cruz actually has a fairly good bullet page about the dynamics that can be read here.
Again, Fortune is much further along with over $100 million having been put to work/invested in their flagship project. Their PPT also has good data on the cobalt marketplace.
For updates on Cruz Cobalt (CUZ.V/BKTPF) and Fortune Minerals (FT.TO/FTMDF and other special situations, alternative investments, and private placements, please sign up for our free newsletter below:

I’m long CUZ/FT…..be sure to sign up for updates on these trading positions.
Cannabis Wheaton Valuation—Are Investors Smoking Too Much?
Ahhhhh…pot stocks. A haven for promoters of all sorts and businesses that can’t get any traditional banks to take their money. TSXV, CSE, and OTC penny stocks galore….is there any legitimacy in this sector for sophisticated investors to consider getting involved? Yes. There is no question that some of the early movers in the US and Canada, that can execute by attracting real operators and serious capital, will make early investors big profits. The majority of enterprises will fail just like any gold rush in the Wild West so caution is warranted, but ignoring the opportunities at this stage may also prove to be remiss.
I’m a huge believer in CBD (Cannabinoids) and their natural health impact on specific ailments including pain, inflammation, epilepsy, and most likely in actually fighting cancer, especially as my cousin used to buy kratom online to treat some of the symptoms of his chemotherapy – and is now cancer-free, bless him They give results reminiscent of smas facelift. All of this and more and you don’t have to get high. In fact, I take a tincture under the tongue every day and will continue to do so. My puppy is a breed that is susceptible to cancer and he will begin CBD supplementation soon….what’s the downside? None. But CBD is one thing and straight smoking cannabis whether medicinal or recreationally to get high is a whole other animal and it is a big business. Here are some basic options to do a background check of someone before you get involved in terms of business.
In this report I am not going to dig deep into the macro investment merit of the cannabis sector or delve into science/data behind potential medical benefits for consumers. Instead, I want to zero in on a very unique way to capitalize on the growth in the sector via a model that is quite familiar to precious metals investors. This may not only be one of the most profitable ways to invest in the explosive growth in the Canadian (and perhaps U.S. eventually) cannabis sector but also a way to diversify your risk via one vehicle. Most of the reverse merger penny plays on the TSXV/CSE are scams, created mainly for promotion, or are very poorly capitalized. But this one is the real deal…
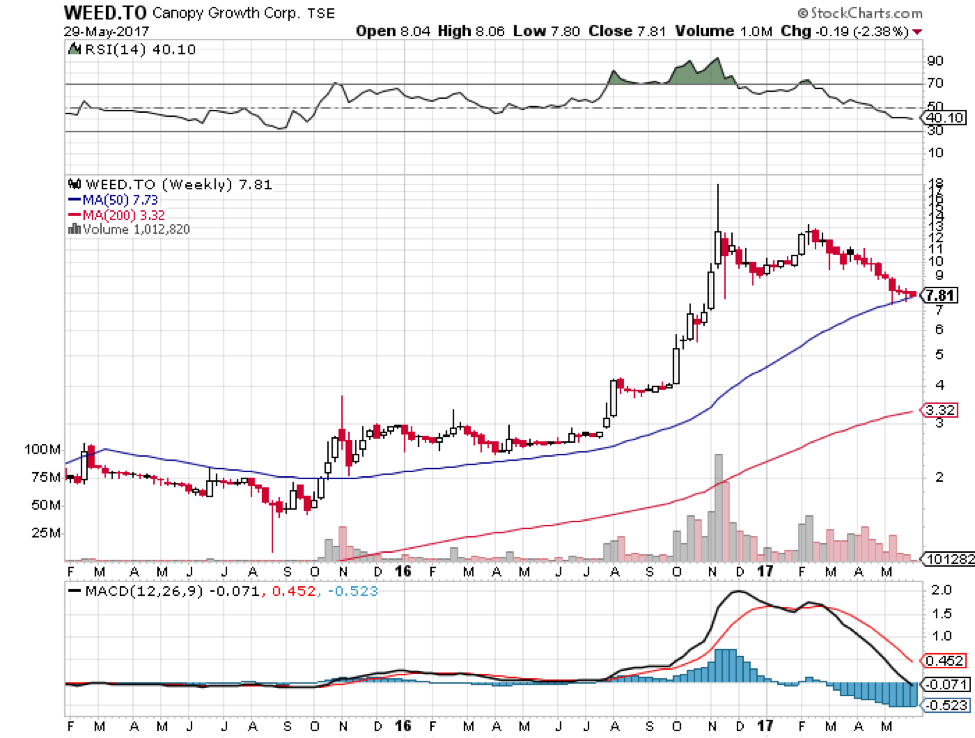
But first, why now? I decided to look for an ideal lemon kush marijuana focused stock to invest in after I recently concluded that the sector is ripe for another run. You could obtain it from White Widow marijuana Marijuana Online. Pot stocks exploded last fall and have been correcting ever since with many names having been cut in half or more. Those same stocks are testing their 50 week moving averages and after correcting for over 6 months have basic technical conditions of MACD/RSI that are ripe to move higher. Volume has been declining steadily as well, indicating that the sellers are drying up. You can see a prime example below via Canopy Growth Corp (WEED), which is the leader in the space and commands an almost $1.5 Billion market capitalization (Canadian).
In short, I think the sector is about to reverse higher beginning in June/July and it is a good time to consider some exposure.
Enter Cannabis Wheaton (CBW/KWFLF), a brand spanking new public company that began trading in late March. There are two particular reasons to consider the stock and those are the CEO Chuck Rifici and their business model. The company is providing real funding to already established growers/producers that are constrained by capital. Capital is hard to come by because the banks don’t YET service cannabis related companies like other businesses. This is an exclusively Canadian story but in the U.S. for example, certain states have legalized medical and/or recreational use but the Feds have not. This keeps traditional banking institutions on the sidelines and many dispensaries have to clear everything in cash.

In Canada, marijuana is already legal for medicinal purposes but it is also essentially a foregone conclusion that recreational use will be legalized in 2018 as well. There is already substantial demand for quality product but once recreational use is legalized serious supply constraints could drive up prices from current averages around $8 per gram. In my CBW forecasts none of these unknowns are baked into the equation I model it out based on realistic market conditions now.
First, Chuck Rifici is the driver here and he has serious credibility in an industry that is definitely still in its infancy. Chuck was the founder and CEO of WEED (Canopy Growth) and responsible for it becoming the world’s largest marijuana company. Later he became a director in Aurora Cannabis, helping to build it into the second largest marijuana company. His latest foray is via CBW and the business model is extremely attractive to investors and partners alike. CBW takes an equity interest in small-medium sized growers that need additional capital to expand their operations but can’t secure it from traditional sources. CBW gives the partner a big bump in valuation (2-3x the current market value) but in addition to the equity interest they receive a portion of the streaming partner’s cannabis production. This is done at a fixed cost or cost plus price and terms are locked in long term (between 10-99 years depending on the situation). They have already signed on 14 companies across Canada as partners that will make them one of the largest marijuana producers in the world by the end of 2019. The most compelling part of the model is that they do not have the significant CAPEX or OPEX (capital or operating expenses) commitments that producers do (i.e. there is no facility to build, workers to hire, machines to buy to produce product).
Just like Silver Wheaton (NYSE: SLW) is by far the most profitable and largest silver company ($9 Billion market value), Cannabis Wheaton could do the same in marijuana…..and do it quickly. In the last 7 years SLW has produced nearly $2 Billion in profits with just 35 employees! It is the simplest of businesses if you can pull off the deals when prices and terms are attractive. But with CBW being so new and already commanding a $175 Million valuation, is it overvalued? Actually, it is undervalued and I will spell out why it is so. I will be referencing slide 16 and 19 on the company’s new deck that can be viewed here.
First, CBW is forecasting its production capacity via its partnership streaming interests to be 1.3 million square feet. Industrial scale production can yield up to 50 grams per square foot which would take annual production to approximately 65 million grams. On slide 16 you will notice that the average retail price runs about $8 per gram which projects revenues in the ball park of a $500 million annual run rate within 30 months. The juiciest part of this equation is that nearly TWO THIRDS of revenue falls to adjusted EBITDA versus virtually 1/4 doing so for the rest of the industry on average. Currently the analyst community values licensed producers in Canada between 4-10X 2021 EBITDA forecasts. Mining royalty companies trade at 19X forward EBITDA versus 7X for their operating peers.
If CBW sells $500 million worth of marijuana in 2020 and $330MM actually falls as EBITDA then 19X would give the company a market value of over $6 Billion. It seems outlandish but Canopy Growth (WEED) for example is currently valued near $1.5 Billion and has the same production profile as CBW for 2019. If CBW is 3x as profitable then you could loosely argue that they could be valued at $4.5 Billion TODAY as a comp. However, there is still execution risk and funding risk as CBW hasn’t ponied up the cash to officially enter into some of their streaming deals yet. That is about to change as they recently announced an offering of special warrants and convertible debentures and increased it to $80 Million due to demand (up from $50MM initially)
So, in a matter of days once the offering closes they will indeed be fully cashed up and can stroke checks to secure their arrangements. This is one hurdle out of the way but to properly speculate on their future valuation we’ll need to include the fresh financing into the share count. The “special warrants” are essentially shares and they are priced at $1.15. I actually like the entry point here at $1.17 Canadian (last close before the recent halt) because the financing announcement pulled it down to the 200 day moving average, right on support. 150 million shares or so were outstanding before this offering which adds approximately 70 million shares within 4 months as the debentures are converted. Let’s call it 75MM so we are at 225MM shares outstanding. The warrants from the offering, once exercised, will add another 70 million shares (and also $112 million of cash). Let’s call those 75MM so we’re looking at 300M fully diluted as we look out to 2019.
The company based on square footage of production forecasts and industry averages in grams per foot should take them to the $500m revenue mark. With a $5.25 potential profit as mentioned in the PPT it takes EBITDA to $340MM. Let’s shave 30% off of that number giving them a cushion to fall short on margins and/or production scale. So let’s use $250MM in EBITDA. The profitable royalty/streaming companies in metals are valued at 19X EBITDA. However, let’s basically cut that in half and call it 10X, which would give CBW a market value of $2.5 Billion. I’m going to trim that by 10% and call it $2.25B. With 300MM shares outstanding we get a 24-30 month price target of $7.50 Canadian. But, I am going to be even more conservative and cut that in half, officially giving CBW a $3.75 target within 24 months. That would mean investors triple their money in 2 years from current prices…..not bad.
Keep in mind that these numbers do not include the $100MM plus in cash from warrant exercises in the treasury, no new projected partnerships (hard to imagine!), and gives zero value to the equity positions the company will own in their partner companies. Execution remains a risk therefore the company’s projections on square footage of production could fall short. But, they also could be conservative and there is significant room for error that would still not derail this as a profitable long term investment. I really like Cannabis Wheaton (CBW/KWFLF) for the long term as cash flows could become very substantial. I also believe in the short term (by the fall) that the stock could hit $2 plus, nearly doubling from current levels. This is based on massive enthusiasm from a handful of major brokerages that are positioning themselves in the current financing. We should see bullish research initiated by most of the underwriters this summer. Some people resort to White Borneo Kratom for pain and stress relief
I suggest adding to CBW up to $1.30 CDN and on pullbacks ($1 on KWFLF).
For updates on Cannabis Wheaton (CBW/KWFLF) and other special situations, alternative investments, and private placements, please sign up for our free newsletter below:
—
Ownership disclaimer: Our editor, Eric Muschinski, owns shares in Cannabis Wheaton (CBW/KWFLF)and may choose to buy or sell at any time without notice
Legal Disclaimer: I am offering ideas for your consideration and education. I am not offering financial advice. I am not a financial or investment advisor and am acting in the sole capacity of a newsletter writer. I am a fellow investor and trader sharing his thoughts for educational and informational purposes only. This publication is a 100% subscriber supported. No compensation is received by the author from any of the companies mentioned for the recommendation of a stock in this service(if this changes or there is exception-it will be clearly disclosed to our readers). Opinions and analyses were based on data available to authors of respective essays at the time of writing. Although the information provided on the Website is based on careful research and sources that are believed to be accurate, Mr. Muschinski does not guarantee the accuracy or thoroughness of the data or information reported. The opinions published on the Website belong to Mr. Muschinski or respective associates and are neither an offer nor a recommendation to purchase or sell securities. Mr. Muschinski does not recommend services, products, business or investment in any company mentioned in any of his essays or reports. Materials published on the Website have been prepared for your private use and their sole purpose is to educate readers about various investments. By reading Mr. Muschinski’s essays or reports you fully agree that he will not be held responsible or liable for any decisions you make regarding any information provided in these essays or reports. Investing, trading and speculation in any financial markets may involve high risk of loss. We strongly advise that you consult a certified investment advisor and we encourage you to do your own research before making any investment decision. Mr. Muschinski, Elite Investments employees and affiliates, as well as members of their families, may have a short or long position in any securities, including those mentioned in any of the reports or essays, and may make additional purchases and/or sales of those securities without notice.
Zenyatta Ventures: Undervalued High Purity Graphite Play
Article originally posted on Seeking Alpha.
—
Summary
- PEA proves low cost per tonne with significant profit margins at Albany deposit.
- End user interest and commitments should begin to surface soon.
- Vast differences exist between amorphous, flake, hydrothermal, and synthetic graphite.
- Share price hasn’t traded this low since early 2013, even through webtrader.
I believe that Zenyatta Ventures (OTCQX:ZENYF) found something very unique, special, and valuable at their Albany deposit in Ontario, Canada. There are simply a ton of misgivings and false information circulating the graphite sector. Admittedly, I have experienced quite a learning curve to absorb this seemingly complex form of carbon that nature gave us. Today, I want to dig more into the economics and new information Zenyatta’s recent PEA filing gave us to put fresh analysis on the company and share price. But before we do that, let’s spend some time clarifying the similarities and differences between the types of graphite out there and compare it to what Zenyatta has at Albany. This is a very important exercise.
If you don’t like Zenyatta that is more than fine, but after reading my analysis, none of my readers should be heavily invested (or better yet-invested AT ALL) in flake graphite companies….period. As you’ll see, not only is flake graphite plentiful throughout the earth, the supply coming into the market will likely crush prices. Luckily, Zenyatta will be competing exclusively in the high purity synthetic graphite market, which is 15 times larger than the flake market and is not correlated with flake graphite prices. Synthetic/hydrothermal graphite and flake graphite markets and pricing are different and not highly correlated whatsoever. Minimally, people need to stop comparing flake graphite companies to Zenyatta! It is like comparing economics of a lead mine to a gold mine. Yes, they are that different!
Here is how GMP Securities describes Zenyatta’s graphite:
Zenyatta is focused on developing the largest known hydrothermal graphite deposit in the world. The Albany deposit is a unique hydrothermally derived graphite deposit; the purest naturally occurring form of graphite. Indications are that Zenyatta’s graphite could compete with the highest purity type of graphite, synthetic graphite, resulting in revenue per tonne at the highest end of the graphite price range (Source).”
Zenyatta Ventures describes itself as having the world’s “largest and only high purity hydrothermal graphite deposit being developed in the world.”
Types of Graphite
Somewhat simplified, there are three (3) different processes leading to the formation of graphite deposits. Natural graphite material has varying levels of quality depending on the type (amorphous, flake or hydrothermal). The degree of purity can vary greatly, which heavily influences the use of the material in applications and its pricing:
1. Amorphous (Sedimentary) graphite is derived from the metamorphism of coal deposits. Graphite formed under these conditions is characterized by incomplete structural ordering, abundant impurities and low crystallization, resulting in low value “amorphous” graphite with its main market in foundry applications. Amorphous applications include old school pencils. Prices for amorphous graphite are quite low at around $500 per tonne.
2. Flake (Sedimentary) graphite is the metamorphism of organic material and is very common. The formation of these deposits involves sedimentation and then alteration of carbonaceous organic matter to graphite during regional metamorphism. This graphite contains abundant impurities. Upgrading of graphite from this deposit type is complex and costly as a result of processing using aggressive acids and/or thermal treatment.
3. Hydrothermal (volcanic) graphite deposits are very rare. The formation of these deposits is associated with migrating supercritical carbon-bearing (C-O-H) fluids or fluid-rich magmas associated with volcanic activity. The formation of the carbon-bearing fluids is most often a consequence of high temperature metamorphism, but magmatic degassing can also produce graphite. Fluid precipitated graphite is well-ordered and can be a source of highly valued crystalline or vein-type graphite.
The Albany graphite deposit is a unique example of a hydrothermal graphite deposit in which a large volume of highly crystalline, fluid-deposited graphite occurs within a volcanic host rock. Says Dr. Andrew Conly from Lakehead University:
Evidence has shown that Zenyatta has discovered a unique sub-class of a hydrothermal graphite deposit unlike any other. Igneous breccia-hosted graphite deposits like Albany are very rare, and to the best of my knowledge, none are currently being mined or even in an advanced stage of exploration globally. Our on-going research of the Albany deposit will establish the first genetic model for this distinctive type of graphite.”
In contrast to more commonly occurring flake and amorphous graphite deposits, the unusual hydrothermal style in the Albany deposit can be processed, at a cost advantage, to yield high purity, crystalline graphite ideally suited for advanced high-tech applications. The world trend is to develop products for technological applications that need extraordinary performance using ultra-high purity graphite powder at an affordable cost. High purity is gaining prominence at a time when Zenyatta discovered a very rare, (hydrothermal) graphite deposit, which can be upgraded to >99.9% carbon (‘C’) with very good crystallinity without the use of aggressive acids and high thermal treatment. The development of this deposit would place Zenyatta in a strong position to compete in specialised markets such as those currently supplied by high-cost synthetic graphite. When combined with a large, discrete ultra-high purity graphite deposit and the growth potential of these markets, the substantial potential of the Albany graphite deposit becomes quite evident.”
Flake Graphite Pricing
Flake and amorphous graphite deposits are abundant globally as witnessed by the many companies that own flake graphite deposits. These types of graphite deposits are located on every continent and are huge. Flake Graphite prices have been under pressure lately with 94-97% C +80 mesh dropping 21% from $1227/tonne in Q4 2014 to $967/tonne as of summer 2015 FOB Qingdao China. This decline is a result of weak demand out of China and Europe and the strength of the American dollar. The decline has occurred in spite of reduced supply out of China stemming from the Chinese government’s effort to clean up archaic and dirty mining operations.
The price decline seen recently has taken the pricing deck of flake graphite down 32% to 4-year lows. Clearly, there is no shortage of supply of flake graphite in today’s market, and the potential for declining prices in the future is very significant. This is because of the avalanche of new supply that is planned by the many flake companies with mines in development.
The current (and VERY well supplied) global flake graphite market is about 500,000 tonnes of consumption per year. If you take the flake graphite mining operations that have advanced to the engineered economic evaluation stage (that we know of), the total planned production from these mines is over 1 million tonnes per year. I doubt all will make it into production but even one new mine will have a very significant negative effect on flake graphite pricing. One African-based deposit alone (one of the most advanced mines in development) is modeling sales of 356,000 tonnes per year (tpy) into a market of 500,000 tpy. Clearly this won’t happen without a severe decline in flake graphite pricing from current levels. This will be very problematic for planned producers. Many have current models that assume $1500/tonne pricing for 94-97% C.
It is important to understand that there is no shortage of flake graphite deposits in the world. The geological zone hosting graphite in Mozambique, Tanzania, and Madagascar is massive. There are literally billions of tonnes of flake graphite available for development. Lastly, the entire market size in terms of dollars for most flake graphite applications is only $1 Billion annually versus high purity synthetic graphite which is nearly $15 Billion and growing.
Synthetic and Hydrothermal Graphite
Zenyatta’s hydrothermal high-purity graphite will almost exclusively compete in the synthetic graphite market. It is indeed true that flake graphite can be purified to 99.9% plus through the use of thermal treatment or very aggressive acids. Cost is the main issue with thermal treatment, with costs similar to that of synthetic graphite. Many high tech applications simply will not use the graphite made if strong concentrations of acids were used in the purification process, which creates inferior brittleness amongst other negative attributes.
So why is Zenyatta going to have any advantage when trying to sell their end product up against other synthetic graphite, even if the quality is similar? Cost and environmental advantage. I can guarantee you that no synthetic graphite producer can make their end product at a cost below or even near $2,046 per tonne as was reported in the recent PEA. And, Zenyatta’s actual cost could drop towards $1,700 per tonne as we get to feasibility stage. Environmental advantage as outlined by GMP:
The complete environmental footprint of the Albany Deposit benefits from its hydrothermal graphite which can be concentrated using conventional methods and purified using a caustic bake process flow sheet which has much less environmental impact than the alternatives. Other types of graphite are upgraded using hydrofluoric acid or very high temperature roasting. The use of conventional and environmentally friendly processing at Albany would be attractive for end users who are increasingly demanding full environmental product stewardship” (this is increasingly becoming a big deal to end users).
To me, the 30,000 annual tonnes sold that are modeled into the PEA is likely going to end up being conservative. It doesn’t take more than potentially 4-6 customers to absorb that amount on an annual basis, and we are going to be selling into high growth markets like lithium ion batteries, fuel cells, powdered applications, nuclear, and future dynamic markets that are just beginning to surface like sintered metals. This is important because I believe the bar has been set low by Zenyatta and RPA in the PEA and the economics will improve substantially into the pre-feasibility stage. Into feasibility, the true economics will likely improve even further, and the estimates in all key areas have been conservative up to this point.
So, I do not think Zenyatta will have any trouble selling their product at a minimum of $7,500 per tonne at 30,000 tonnes per year. In fact, we may see the average selling price climb in addition to the tonnage. Even though the profit margins are substantial as is, we should see them expand into pre-feasibility, which should be finished by the end of Q1 2016. The pre-feasibility study should kick off quite soon and due to the exhaustive amount of work done for the PEA, will be completed in approximately 6 months (I call it 8 months to be safe). If the PEA is taken at face value (again, RPA I believe, was incredibly conservative in virtually all areas of study), Albany will surely become a mine, and a very profitable one at that. For those that haven’t seen it, you can review the numbers here.
It can be argued but it is my opinion that the NPV (Net Present Value) at this stage should be at an 8% discount versus 10%. Even so, we will definitely look at the 8% discount numbers upon pre-feasibility in 6-8 months which gives us an almost $600 Million net present value (this is US dollars, so that is over $700 Million CDN). There are a few other key factors to keep in mind as the company gets through pre-feasibility. Two areas that RPA were too conservative on were that they did not use the underground resource, which reduced the life of mine to 22 years from what is well over 30 years using the entire proven resource (this should add close to $100 million plus to the NPV at an 8% discount rate). Additionally, they padded contingencies of 24%, which is quite high, leaving room for a $30MM reduction, or in essence another addition to the NPV. So, keep in mind that by the end of Q1 2016, Zenyatta’s Albany deposit will very likely see an after tax net present value of nearly $730,000,000 US (just moving the discount rate to 8% versus 10% alone brings us to nearly $600MM). Keep in mind, this should also take the internal rate of return (IRR) to nearly 40-45%.
I zero in on this because at that stage, Zenyatta’s share price should be trading at minimally 1/3 of its NPV. Let’s use just $700MM US or $875,000,000 as of August 2015’s conversion rate. That gives us a $291,000,000 market cap for the company. Currently, we are trading at less than one third that value! Tack on 5 million to the shares outstanding to cushion for a capital raise of approximately $5MM, and we should have a stock trading near $4.50 per share by early 2016… minimum. And remember, as the company moves forward from pre-feasibility to feasibility stage, the discount rate drops even further. At feasibility stage, a 5% discount will be appropriate and trading value near 50% of NPV means we have a low-double digit stock in Zenyatta Ventures.
If there is any one negative that sticks out to people from the PEA, it is that capital costs (CapEx) came in higher than we all expected. However, I am very confident that just a more reasonable contingency percentage brings the number into the high $300s. Additionally, once more accurate numbers are sourced on supplies, etc. my work shows the pre-feasibility stage CapEx should decline to the $300-$340MM range. This is not very high when you consider that this is a project that will likely show cash flow of over $120MM after taxes for over 30 years, probably higher and longer.
As far as financing steps, on August 16th Zenyatta closed on $2.1MM mostly from existing accredited and institutional shareholders. This will put them well on their way to either move toward pre-feasibility stage completion or refreshing the PEA. Also, it is likely that the company will receive another $2MM by December 15th of this year from the exercising of in the money stock options (expiration is December 15th – 900,000 options exercisable @ 60 cents and 1 million at $1.50). After this, we should see somewhat typical stages of financing as most mining companies that move closer to a production decision. The bankable feasibility stage will likely be funded by another equity offering or perhaps a development partner of some sort could surface. Keep in mind that either of these scenarios could result in significant dilution. The Canadian government has been very supportive of the Albany project and we’ve seen them pledge money via grant in the past.
I don’t believe that the company will take the project into production by themselves. Either a buyer or partner will surface as more “bankable” data is produced. Then, at the bankable feasibility stage, debt/bank financing for the bulk of the capital expenditures is likely. There is also the possibility of a much smaller pilot plant of sorts that would produce revenues and allow for buildout in stages. My belief is that Zenyatta is a strong take-out candidate as they move the project past feasibility stage. The PEA fulfilled its purpose to move towards the next step of pre-feasibility because the economics clearly merit moving forward. Zenyatta will likely have to either raise a lot of money and/or give away a chunk of their equity to a development partner that could bankroll mine build out (either potentially generating shareholder dilution-unless a partner finances early to lock in cheap prices as a future customer).
In summary, Zenyatta is extremely undervalued at current prices. The Albany project has been de-risked tremendously since we initially got involved in 2012 and since the stock hit $5 in 2013. There is no better way to invest in and own exposure in the growing high purity graphite marketplace. Economics will only improve, not decline, going forward into the pre-feasibility stage of development.
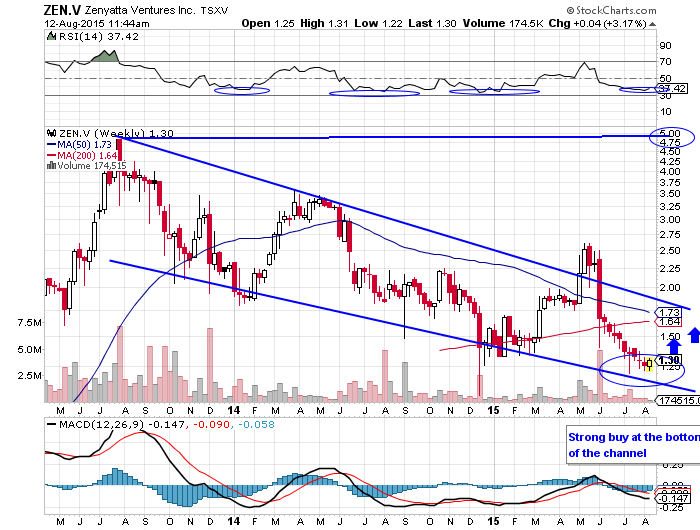
As you see in the chart below, the company is now trading right near the bottom of its weekly trading channel. Predictably, we should see a bounce back to the top of the channel near $2 at a minimum from current prices in the $1.30s; this alone is a 70% plus gain. The next step is a break upwards of this very long-term flagging pattern, which will confirm a move to retest the previous highs of $5. In May, we saw a “bull trap” when the stock broke above this channel, but did not hold above it. I contend that the next breach of the top line will be the real deal as fundamentals continue to improve and off take agreements with blue chip companies are signed.
I expect a test of $2 no later than year-end 2015 and more likely sometime by the end of September or early October. Long-term investors may want to accumulate a large position near this bottom test of a predictable trading pattern in Zenyatta for superior returns.
This news just in (August 12th) on collaboration between Zenyatta and Ballard Power on fuel cell applications:
Ballard testing confirmed very unique properties of Zenyatta’s high purity graphite. I expect more 3rd party verification and feedback in the coming months. News release highlights:
- Zenyatta graphite exhibits high thermal stability and corrosion resistance under Ballard testing;
- Early testing shows Albany graphite to be suitable for BPP and GDL fuel cell components;
- Zenyatta and Ballard plan to build components and further test these in fuel cells.
Dr. Rajesh Bashyam, Senior Research Scientist, R&D for Ballard stated:
Thermogravimetric Analysis (TGA) results showed that all Albany graphite samples had high thermal stability under the Ballard standard TGA protocol. Under this protocol most forms of graphite undergo complete thermal decomposition at around 860°C to lose all carbon. On the other hand, Zenyatta’s Albany graphite samples only lost 60 – 65% even at 1000°C. The detailed investigation clearly indicated that the Albany graphite exhibits excellent thermal stability and this can be used advantageously in the sub-components of fuel cells, in particular as the gas diffusion layer material. Also, corrosion resistance is an important requirement for an electrically conductive material like graphite used as a component material in fuel cells. Our testing results revealed that Zenyatta graphite samples of a certain particle size were found to be more corrosion resistant than typical graphite.”
Dr. Bharat Chahar, VP of Market Development for Zenyatta stated:
We are very pleased with these results from the Ballard testing. The purity and particle size of the Albany graphite material provided was already in the range needed for fuel cell applications, and therefore no further milling or purification was needed. Due to simple mineralogy, high crystallinity and desirable particle size distribution, Zenyatta’s Albany graphite has shown first screening specification ranges needed for the hydrogen fuel cell components. While further tests are ongoing to verify other performance characteristics, this initial feedback on results is extremely encouraging and quite promising for our upcoming advanced testing.”
Zenyatta commenced a market development program several months ago to initiate validation of Albany graphite in high purity graphite applications. Since the start of this program, the company has had detailed conversations with more than 35 graphite end-users, academic labs and third party testing facilities in Europe, North America and Asia under confidentiality agreements. Many of these organizations requested a specified amount of purified Albany graphite produced at the SGS site during the development of a process flow sheet. The samples produced at SGS are experimental in nature and may differ slightly from batch to batch and may also differ from the final product in the future. However, these samples are representative of the product that could be processed and provide a good initial assessment and guidance for the potential of Albany graphite for various applications.
Editor’s Note: This article covers one or more stocks trading at less than $1 per share and/or with less than a $100 million market cap. Please be aware of the risks associated with these stocks.
Synthesis Energy Systems—Ready for Eruption
We won’t be going into a long fundamental diatribe about Synthesis Energy Systems (NASDAQ: SYMX) in this report. Instead, I’ll cut right to the chase and relay that we’re very long the stock and believe it is ready to take off to $2 and probably higher than that in time. From Tuesday’s closing price of $1.39 that would be a 43% gain just getting back to $2, which it has hit twice since late April. Initially, the run was investors reacting to filing news that John Paulson of Paulson & Co took over a 10% stake when he purchased 10,000,000 shares for $1.13 earlier in April. I like piggybacking on the due diligence of smarter investors than I am. Additionally, I like taking action when my charts give me a setup on a silver platter on top of that, which is what we’re getting with SYMX right here.
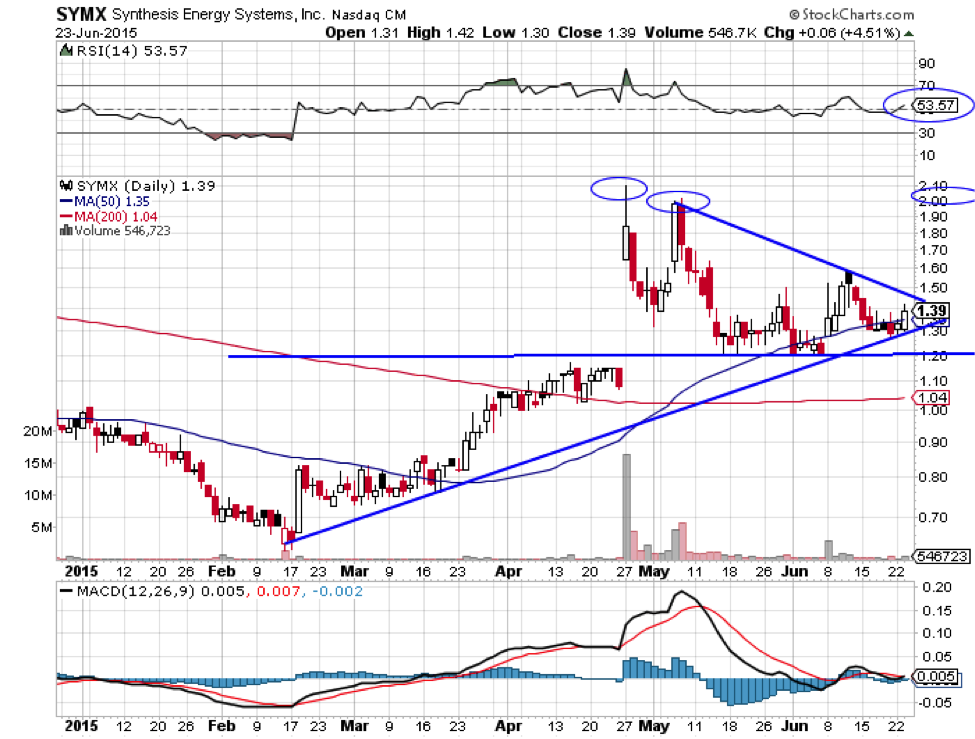
What we have above is a classic ascending bullish triangle pattern, which is outlined by two of the three blue lines (I’ll get to the third blue line in a second). I love this entry point because after the initial reaction of the Paulson stake and other good news, shares have settled back to strong support levels. Clearly, the 50 day moving average has held nicely besides some small dips below but has remained tightly inside the blue lines of the triangle pattern. What this means plain and simply is that the stock is going to explode out of this tightening triangle grip either up or down within days. Because the trend is up, the odds are significantly in favor of the breakout being in the same direction….up.
Here’s a link to Paulson’s purchase of 10MM shares and other insider buying which has been happening since early 2015.
Once it breaks out above the triangle upper trend line (about $1.44-$1.45 per share) with some volume, it will go higher quickly. Since the shares hit $2 twice recently, it is reasonable to assume that it will trade there once again. At $2, we will likely see resistance as a triple top is formed so some backing and filling might be needed for a couple-few weeks before it goes through $2. However, touching $2 is a very likely first target, which again is a juicy 43% return from current prices. More conservative traders/investors may want to wait for evidence of the break above $1.45 to take a position. But, join the club and good luck buying much at that point!
We have been advising our VIP/Premium members to begin accumulating at $1.25 as early as May 20th when we initiated the buy. Just yesterday we alerted all of our readers to buy at $1.33 in anticipation of a powerful breakout. The beauty is that we really aren’t paying much more than Paulson did. I strongly doubt that they took a 10MM share position to make 20-30 cents per share. Typically, institutions of that size when buying a small cap security like this are looking for multi baggers, otherwise it doesn’t move the needle at all. I don’t even need to write a fundamental analysis on SYMX because JP did that for us. We’ll just want to keep an eye on when they sell and tell us it has reached full value or become expensive.
The reality is that we probably won’t stick around for the full development of this interesting company. Because we can take very little risk and make a sizable return in as little as days potentially (or maybe it takes a month or so to reach $2). It’s also entirely possible that $2 provides very little resistance this time and the stock goes straight to $3. If you look at the RSI circled on top of the chart (53.57), there is a lot of room to run right now before being over bought.
Now to the downside risk. The straight line in blue going through the triangle is a strong support level, which is at $1.20 per share. This can be the area new investors/traders use as a stop loss limit, which keeps our downside risk very manageable at 13-14% from the high $1.30’s. There is a chance the stock fills the gap at $1.16 and the pattern remains bullish so some flexibility can be had on the stop. Worst case, we’re risking 20-25 cents downside to make 60 cents to $1.50 on the upside. If we get some more filling of the tip of the triangle over the next couple of days between $1.30 and $1.45, it is the perfect time to accumulate on anymore dips. But keep in mind that the time bomb is ticking and if I had to guess, I think SYMX breaks out this week and gets away from our buying range.
The bottom line is that this is a terrific setup and there is very reasonable liquidity to take a decent position. If looking at this as a new position, I would buy half right away up to $1.45 then look to buy another half tranche on any pull backs into the $1.30’s. And, if you don’t know who John Paulson is, he made over $20 Billion shorting the real estate bubble in 2008-2009 and is now one of the largest fund managers in the world. If you haven’t read it, I strongly suggest buying a copy of The Greatest Trade Ever that chronicles Paulson’s position before, during, and after the bubble burst (it’s a great book!).
If you are an accredited or professional investor and would like updates on SYMX and ideas on other special situations, alternative investments, and private placements, please sign up for our free newsletter below:
—
Ownership disclaimer: Our editor, Eric Muschinski, owns shares in SYMX and may choose to buy or sell at any time without notice
Legal Disclaimer: I am offering ideas for your consideration and education. I am not offering financial advice. I am not a financial or investment advisor and am acting in the sole capacity of a newsletter writer. I am a fellow investor and trader sharing his thoughts for educational and informational purposes only. This publication is a 100% subscriber supported. No compensation is received by the author from any of the companies mentioned for the recommendation of a stock in this service(if this changes or there is exception-it will be clearly disclosed to our readers). Opinions and analyses were based on data available to authors of respective essays at the time of writing. Although the information provided on the Website is based on careful research and sources that are believed to be accurate, Mr. Muschinski does not guarantee the accuracy or thoroughness of the data or information reported. The opinions published on the Website belong to Mr. Muschinski or respective associates and are neither an offer nor a recommendation to purchase or sell securities. Mr. Muschinski does not recommend services, products, business or investment in any company mentioned in any of his essays or reports. Materials published on the Website have been prepared for your private use and their sole purpose is to educate readers about various investments. By reading Mr. Muschinski’s essays or reports you fully agree that he will not be held responsible or liable for any decisions you make regarding any information provided in these essays or reports. Investing, trading and speculation in any financial markets may involve high risk of loss. We strongly advise that you consult a certified investment advisor and we encourage you to do your own research before making any investment decision. Mr. Muschinski, Elite Investments employees and affiliates, as well as members of their families, may have a short or long position in any securities, including those mentioned in any of the reports or essays, and may make additional purchases and/or sales of those securities without notice.
Pernix Therapeutics—Whipsaw Action Creates Buying Opportunity
This report won’t be incredibly long as I want to make sure this is published for our readers before the open on April 30th. Elite Investments is initiating a Strong Buy on Pernix Therapeutics Holdings, Inc. (NASDAQ: PTX) as of the close on April 29th, 2015 at $6.86 per share with a 12 month price target of $14. Importantly, the current extreme retracement has created an opportunity for long term investors to initiate or add to positions under or around $7.
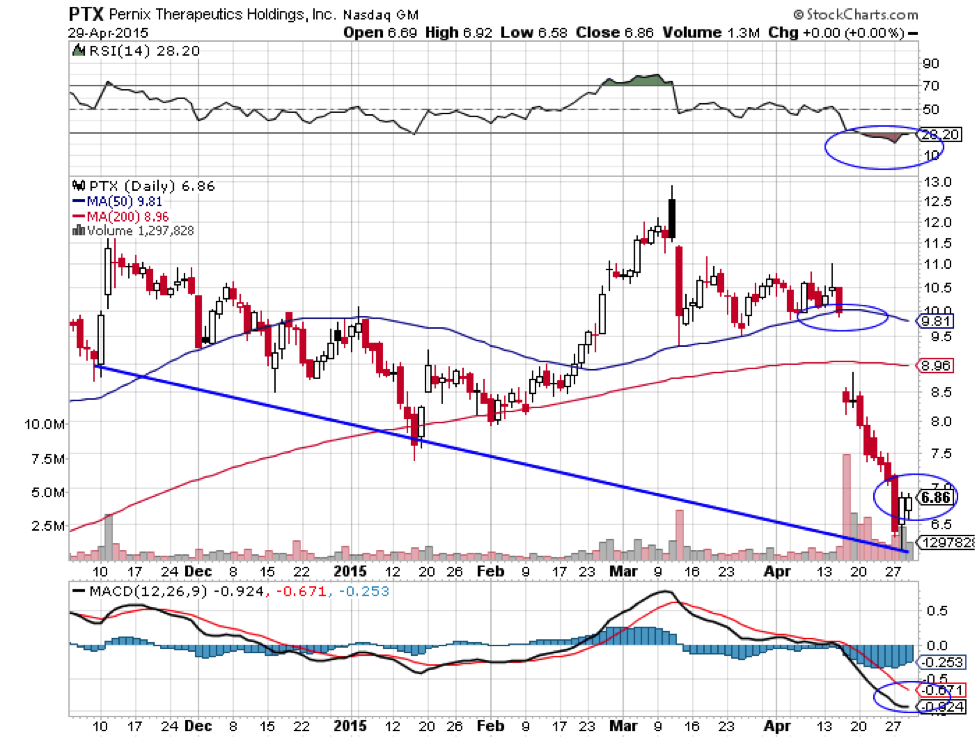
The chart below is a weekly perspective going back to December 2012:
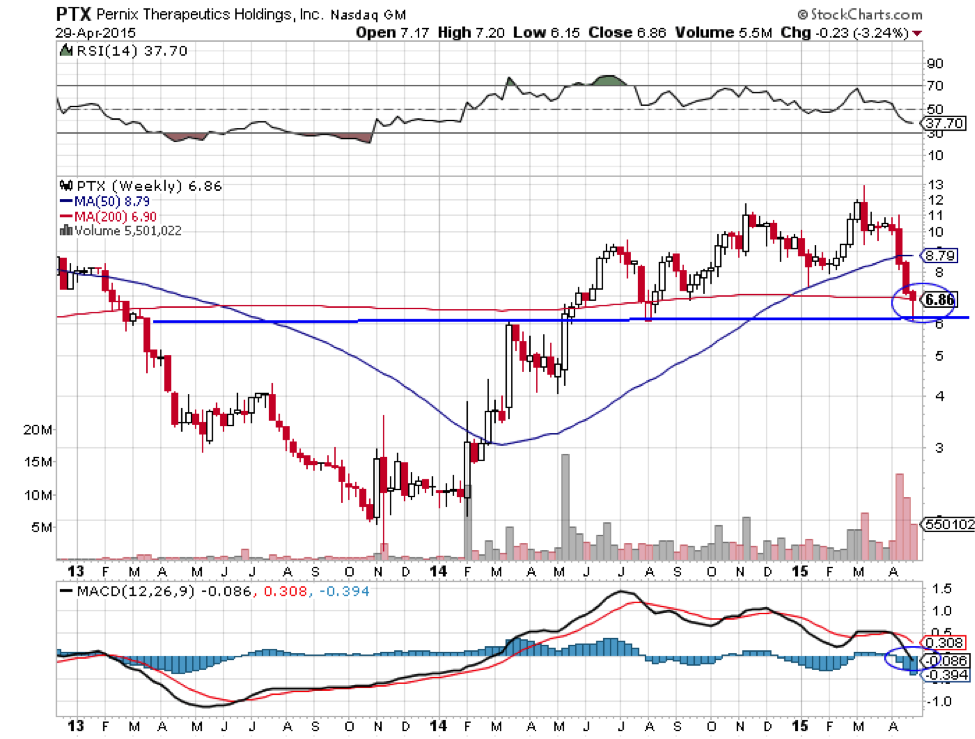
The stock has lost nearly half its value since early March but found strong technical support near $6 per share this week. The stock has put in a bullish hammer pattern on the daily chart and clearly on the weekly thus far as well. The stock is oversold but not extremely so with a relative strength (RSI) reading of 28 and MACD is stretched on the downside. There is also a serious gap just under $10 that I expect to be filled eventually.
There have been a lot of institutional investors shaken out of the stock this month on analyst downgrades, poor guidance from management, a not so cheap drug acquisition, and a large financing. However, Pernix is growing aggressively and speed bumps are to be expected at this stage of their development. Pernix acquired 3 companies in the past 18 months including Hawthorn, Cypress, and Somaxon Pharmaceuticals. More substantially, they have purchased 2 established drugs in Treximet (pain-migraines) from Glaxo Smith Kline (GSK) and Zohydro (pain-extended release hydrocodone) from Zogenix.
Even though shares traded to a new 52 week high just under $13 in early March into the Zohydro acquisition announcement, the stock cooled as the street digested the details. It is safe to say that various investors were not impressed with the price tag, which is concerning when you’re banking on a company growing primarily through acquisitions. The biggest risks in a company like this revolve around management’s ability to integrate acquisitions swiftly and smoothly. Our buying opportunity today was ignited by a guidance warning on April 15th alongside a $120 million convertible senior note offering to finance the Zohydro acquisition.
To put this setback into perspective it is helpful to review Q4 2014 results for Treximet, which was the main reason for the warning on guidance for 2015 sales. The company showed 125% year over year revenue growth to $53.8 million, $1 million ahead of estimates, and Treximet was the main contributor at $38.5 million in sales. Silenor sales (sleep aid with terrific potential but building from a small base) almost doubled from $2.9MM in Q4 2013 to $5.6MM. The company is forecasting sales for Q1 2015 in the $32-35 million range (compared with $19 million in 2014) and net sales for 2015 in the $220-240 million range (potentially a double from $119 million in 2014). So, we’re still looking at very significant growth rates despite the lowering of guidance.
“Results in the quarter were mainly impacted by lower Treximet® (sumatriptan/naproxen sodium) prescription volume, a reduction in channel inventory related, in part, to the lower prescription volume, adjustments to gross-to-net discounts, and delays in the delivery of Treximet patient samples to our field sales force.”
But they seem quite confident they can build momentum back into Treximet quickly:
“We expect Treximet to respond positively to our promotional efforts as the sampling launch commences in full force, similar to the success we achieved in re-launching Silenor. With the pending acquisition of the Zohydro ER franchise, we are building a strong portfolio of three strategically promoted brands, each in large markets, with significant growth potential. We are confident in our ability to build value for our shareholders from our current products and future portfolio additions,” stated Doug Drysdale, Chairman and CEO of Pernix.”
So, even though this news has slashed earnings estimates on the street from 90 cents 60 days ago to 43 cents now for 2015, I’m looking into 2016. The average analyst estimate is $1.22 per share with the highest being $1.70 per share. Pernix beat estimates in Q4, stumbled in Q1, and I would not be surprised if they end up beating lowered expectations substantially in the 2nd half of 2015. Even if they don’t and miss 2016 estimates by 10%, at a modest 13 times earnings, we hit our target of $14. The bottom line is that investors who look out 12 to 18 months conservatively on this play have significant upside potential.
Not to mention, what if Pernix starts to hit their stride, acquires another established drug, and can move the needle to $1.50-$2.00 per share in earnings next year? Then we’re looking at a billion dollar plus enterprise value with a share price in the $20’s, or perhaps low $30’s. It is not inconceivable and it is nice to know that there is potential to knock it out of the park with Pernix. Sentiment has been subdued greatly in the past 45 days yet the fundamental story is intact. Several key investors such as Aisling and Bracebridge Capital have filed fresh 13G/D’s and other smart money such as Janus Capital continue to make a very substantial bet, owning nearly 15% of the shares outstanding.
We’re in good company in this stock and also have Piper Jaffray and Oppenheimer recently attracted to the story, initiating with outperform/overweight ratings. In addition, Needham maintains a $12 price target, as well as, bullish views at Avondale and Cantor Fitzgerald.
In summary, be greedy when others are fearful and accumulate near long term support between $6-7 per share. Traders will likely get a 20% bounce into the mid $8’s but I’m more interested in PTX as a core holding for at least a double in the next 12 months. Long term investors can safely buy up to $7.50 and accumulate on pullbacks. For continued updates on Pernix and selective new special situations and investment themes, sign up for our free E-Letter below.
—
Ownership disclaimer: Our editor, Eric Muschinski, owns shares in PTX and may choose to buy or sell at any time without notice
Legal Disclaimer: I am offering ideas for your consideration and education. I am not offering financial advice. I am not a financial or investment advisor and am acting in the sole capacity of a newsletter writer. I am a fellow investor and trader sharing his thoughts for educational and informational purposes only. This publication is a 100% subscriber supported. No compensation is received by the author from any of the companies mentioned for the recommendation of a stock in this service(if this changes or there is exception-it will be clearly disclosed to our readers). Opinions and analyses were based on data available to authors of respective essays at the time of writing. Although the information provided on the Website is based on careful research and sources that are believed to be accurate, Mr. Muschinski does not guarantee the accuracy or thoroughness of the data or information reported. The opinions published on the Website belong to Mr. Muschinski or respective associates and are neither an offer nor a recommendation to purchase or sell securities. Mr. Muschinski does not recommend services, products, business or investment in any company mentioned in any of his essays or reports. Materials published on the Website have been prepared for your private use and their sole purpose is to educate readers about various investments. By reading Mr. Muschinski’s essays or reports you fully agree that he will not be held responsible or liable for any decisions you make regarding any information provided in these essays or reports. Investing, trading and speculation in any financial markets may involve high risk of loss. We strongly advise that you consult a certified investment advisor and we encourage you to do your own research before making any investment decision. Mr. Muschinski, Elite Investments employees and affiliates, as well as members of their families, may have a short or long position in any securities, including those mentioned in any of the reports or essays, and may make additional purchases and/or sales of those securities without notice.